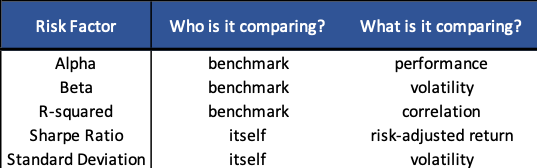
What if your investment goes wrong? In the world of investing, there are five major risk measures that investors often look at to examine their investments risk: alpha, R-squared, beta, the Sharpe ratio, and standard deviation.
Although these figures do not tell investors the exact return of their investment in the future, combined they give a rough sense of what performance can be expected from their investment moving forward. In other words, these risk measures can determine whether the investment’s risk is minimal or risky.
R-squared or R2
R-squared is a measure of correlation. It indicates the level of connection between a security’s price movement and its benchmark index’s performance.
In investing, R-squared is commonly viewed as the percentage of a security return that can be rationalized by the performance of its benchmark index.
R-squared proportion ranges from 0.00 to 1.00 or 0% to 100%. An R-squared of 100% suggests that the security price is perfectly correlated to its benchmark index; that is, all of its performance can be explained by the movement of its benchmark index.
An R2of 0% implies that the fund has no correlation with the benchmark, and all the events that trigger the benchmark volatility do not have any impact on the security. Accordingly, one can say that the lower the investment R-squared, the more its performance is influenced by factors other than the market as measured by that benchmark index.
Normally, a security with a R-squared between 85% and 100% has a historical stock price that moves comparatively accordant with its benchmark index, whereas one with a low R-squared, 70% or less, has a past performance that does not generally follow the movements of its benchmark index. The beta of this type of security lacks a practical meaning since R-squared plays a crucial role in determining the efficacy of beta.[1]
Essentially, R-squared is a tool that informs investors of the helpfulness and dependability of a security beta, and the interplay between these two measures gives a whole big picture of security performance and risk.
Beta
Beta is a measure of volatility. It suggests how volatile a security is as compared to its benchmark index. In investing, volatility is commonly regarded as investment risk, which is defined as the probability that an actual return on an investment will be lower or higher than the investor’s expectations. Simply put, beta tells investors whether a security or a fund is riskier than its benchmark index.
Beta has a proportion range of ±1. A beta of 1 indicates that a security’s price fluctuates in a similar manner as its benchmark index. In other words, if the security’s benchmark index rises 2%, the security may jump 2% as well, and vice versa.
A beta greater (less) than 1 indicates a security is more (less) risky than its benchmark index, and therefore its price will swing more (less) wildly. That is, if the fund’s benchmark index drops 10%, the security with a beta of 1.2 may plunge 12% (10%*1.2=12%), falling 2% more than its benchmark index.
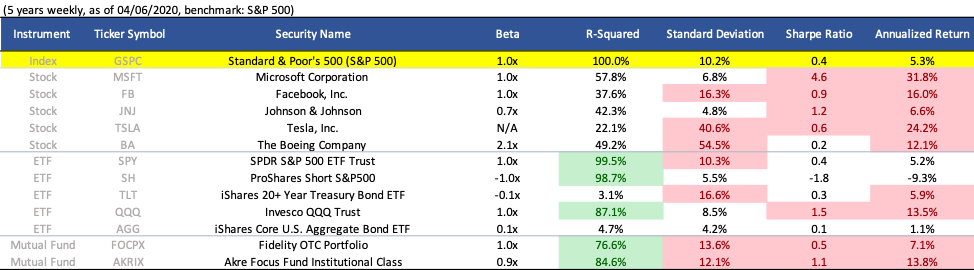
The same pattern of movement would occur in the rising scenario too. A beta less than 0 moves inversely with the market. It is rare to see stocks like this, but there are plenty of ETFs offering beta like this in the market, such as the iShares 20+ Year Treasury Bond ETF (NYSE Arca: TLT) and ProShares Short S&P500 (NYSE Arca: SH) (see Figure 1.0). Using SH as an example, its beta of -1.0 tells us that if its benchmark index falls 10%, SH may gain 10% instead (-10%*-1.0=10%), and again, vice versa.
At this point, those who have some experience in investing and who have looked up several securities to seek the pattern I mentioned may be a bit confused. “I just checked out the beta of Tesla, Inc. (NASDAQ: TSLA) on Yahoo Finance,” you may say. “And I saw a beta of 0.7 (as of 4/6/20)![2] Are you telling me that Tesla stock is less volatile or risky than the market and will rise only 7% when other stocks are generally jumping 10%? That’s nonsense!”
Here is my point: the movement patterns I mentioned earlier are likelyto happen only on the securities that have an R-squared of more than“70%.” Since TSLA has an R-squared of only 22.1%, the rules mentioned earlier do not apply to this security (see Figure 1.0). Moreover, if you look closely at Figure 1.0, you’ll realize that every stock has a R-squared of less than 70%.
This even happens to all the stocks in the top 10 holdings of stock index Standard & Poor’s 500 (S&P 500), including Microsoft Corporation (NASDAQ: MFST) and Facebook, Inc. (NASDAQ: FB). “Then why are those finance websites still showing beta to investors if it’s not a reliable figure?” you may ask. It is because beta is often used in complex analytical models, such as the capital asset pricing model (CAPM).
Investors should bear in mind that one cannot get reliable information related to investment risk by solely examining beta.
Wise investors will use beta in conjunction with R-squared to get a big picture of the overall risk of the security. For example, mutual fund Akre Focus Fund Institutional Class (NASDAQ: AKRIX) has a beta of 0.9 and an r-squared of 84.6% (see Figure 1.0).
Used together, what they indicate to investors is that 84.6% of AKRIX swings 10% less than the S&P 500, which suggests that the mutual fund is overall 10% less risky than the S&P 500.
From beta and R-squared of AKRIX, it is also clear that 15.4% of AKRIX price movement is contributed by factors that do not generally affect the general market.
The beta or volatility of this 15.4% of AKRIX is unknown, and it may cause AKRIX to be more volatile or earn (lose) more than expected.
This unknown portion, according to the definition of R-squared, may have contributed to AKRIX’s much higher return than its benchmark S&P 500.
Working together, after all, beta and R-squared give an overall picture of how risky an investment is as compared to the general market.
Standard Deviation
Standard deviation is a measure of volatility as well. While beta gives a sense of how volatile a security is compared to its benchmark index, standard deviation tells investors the volatility of a security’s historical average return. That is, the possible level that the actual return deviates from its past average return (or expected return).
Greater standard deviation reflects a wider return, and narrower standard deviations imply a more concentrated return. For example, The Boeing Company (NYSE: BA), which has a standard deviation of 54.5%, has an annual return as high as 82.3% in 2018 and as low as -60.8% in 2020 over the past five years, whereas Johnson & Johnson (NYSE: JNJ), a stock with a standard deviation of 4.8%, has an annual return as high as 14.5% in 2017 and as low as -2.5% in 2018 over the same period, indicating much more concentrated returns than BA.
In investing, standard deviations are often used together with average annual returns to examine whether the risk involved with the investment would be tolerable for investors. For instance, although BA has an appealing return of 12.1% annually, it would be unwise to invest in BA without considering whether the investor can withstand the possible loss of around 60% in one year.
Not surprisingly, neither higher nor lower standard deviation is necessarily preferable. It all depends on one’s investment objectives and the level of risk one can shoulder. If a person were planning to accumulate enough funds to establish a start-up five years later, it would be reckless for him or her to go all in on a stock with a high deviation like BA, although it may generate a return of more than 82% for investors in a year. Normally, people with this investment objective will choose securities that have a decent annual return and low standard deviation, like the SPDR S&P 500 ETF Trust (NYSE Arca: SPY) and Invesco QQQ Trust (NASDAQ: QQQ), to ensure the safety of their initial capital.
Sharpe Ratio
The Sharpe ratio is a measure of historical risk-adjusted return. It is the annual average return earned in excess of the 10-year Treasury yield rate (or risk-free rate) per unit of standard deviation (or volatility). Investors generally interpret the Sharpe ratio as the return per unit of risk taken.
In some cases, analytical models may result in a negative Sharpe ratio. This is due either to the risk-free rate being higher than the security return or the security return is estimated to be negative. In either case, a negative Sharpe ratio does not convey any useful information.
Typically, the higher the value of the Sharpe ratio, the more attractive the investment is. What the Sharpe ratio answers is the question of whether a portfolio’s outperformance is due to smart investment decisions or a result of excessive risk. While high returns are ideal for everyone, an investment can only be good when the high returns are not the result of an unnecessary amount of risk.[3]
Alpha
Alpha is a measure of performance. It is the excess return of a portfolio relative to the return of its benchmark index. For instance, the five-year annualized average return of mutual fund Fidelity OTC Portfolio (NASDAQ: FOCPX) is 7.1%, and its benchmark, the S&P 500, has a return of 5.3%. Subtracting the return of the mutual fund from the return of its benchmark, we can see that the alpha of Fidelity OTC Portfolio is 1.8%.
Generally, alpha is the result of active trading rather than passive investing. The number may be positive or negative, depending on whether the fund manager has executed the right investment decisions throughout the calculated period.
Alpha is often represented as a single number (like +3.0 or -5.0). Using the example earlier, the alpha of mutual fund FOCPX is +1.8. A zero alpha would imply that the performance of the portfolio or fund is perfectly in line with the benchmark index. In other words, the fund manager has not added or lost any additional value to the fund, and the portfolio return is a result of a general movement in the greater market.
Moreover, it is noteworthy that alpha is best utilized when the fund is comparing an index of a similar asset. Say Fidelity OTC Portfolio, which is a portfolio made up mainly of stocks, selects an aggregate bond index as its benchmark.
Although the alpha may be as high as 10% or more, it does not tell anything about the investing skills of the fund manager. The risk involved in investing stocks and bonds is entirely different. It is common for a bond index to have an annual return of 1% to 3% and a stock index to have a return of 5% to 13%.
Romero Mentoring’s Analyst Prep Program

The Analyst Prep Program teaches the technical and practical skills that investment banks, hedge funds, and private equity & consulting firms look for in a candidate. Students begin with little to no technical skills and develop into fully prepared professionals who can perform as first-year analysts from day one through the program’s training and internship.
Our Story
Luis Romero, founder of Romero Mentoring, spent five years developing an analyst training program that he wishes he had when he was in college – especially one that gave him access to a complete training and finance internship experience that could advance his career. Since no opportunity like this existed to him at the time, Luis went through a stressful recruiting process like so many others have. He successfully landed a full-time job offer upon graduation and worked as an M&A analyst at Credit Suisse in NYC for two years. He then moved to the buy-side as a junior trader and analyst. After gaining experience there, he created his own fund, Romero Capital, and later become an instructor in financial modeling and valuation. After working with hundreds of professionals and analysts, Luis became committed to creating his own mentoring program because he understood the crucial need for a hands-on, personal experience in the competitive world of finance.