
How do you value a stock? How do you know if a stock is overvalued or undervalued? When should I buy or sell? These are some of the most commonly asked questions when it comes to investing. While there is no absolute way to value a stock, there are various methods that professional investors and financial institutions use to determine the value of a stock.
Stock Multiples Valuation Analysis
Multiples analysis involves using a company’s financial metrics to determine the value of the stock. Professional investors and institutions employ a variety of valuation multiples, and in this article, we will examine some of the most common ones used.
Price/Earnings (PE) Ratio
The PE ratio looks at the profitability of a company to determine the value of the stock. It is calculated by dividing the current price of the stock by the company’s earnings per share (EPS). Because not all companies are profitable, it is not uncommon to see a stock with no PE ratio. If a stock is trading at $50 per share and its EPS is $2.00, the company’s PE ratio will be 25.
Enterprise Value/EBITDA (EV/EBITDA) Ratio
This method focuses on a company’s EBITDA (earnings before interest, tax, depreciation, and amortization), which is an approximation of the firm’s cash flows, to determine the value of the stock. It is calculated by dividing the firm’s enterprise value (market value + net debt) by EBITDA.
Enterprise Value/Sales (EV/Sales) Ratio
Unlike the EV/EBITDA ratio, this method values a company by looking at its total revenue as opposed to EBITDA. The EV/Sales ratio is more widely used than the PE ratio and EV/EBITDA ratio because most firms have positive revenue even if they are not profitable. It is calculated by dividing the firm’s enterprise value (market value + net debt) by total revenue.
A firm’s multiple is heavily influenced by its revenue growth and earnings growth. A company with high revenue and earnings growth will trade at higher multiples than a company with decreasing revenue and contracting margins. In addition to the company’s financial state, the industry and sector that it is in also play a part in valuation. Companies in fast-growing industries such as tech will trade at much higher multiples compared to companies in declining industries such as department retail.
Discounted Cash Flow Analysis
A discounted cash flow (DCF) analysis is one of the most common methodologies used when it comes to stock valuation. This method looks at the future cash flows of the company and discounts it using the firm’s weighted average cost of capital (WACC) to derive the intrinsic value of the stock.
To perform a discounted cash flow (DCF), you must first calculate the firm’s WACC. This can be calculated using the formula WACC = (cost of equity * weight of equity) + (cost of debt * weight of debt)*(1-tax rate). After calculating WACC, then you must forecast the unlevered free cash flow of the company (typically 5-10 years). From there, discount each year’s unlevered free cash flow using the firm’s WACC to arrive at the sum of present value of the firm’s unlevered free cash flow.
Now that you have the firm’s WACC and sum of present value of unlevered free cash flow, it’s time to determine the terminal value of the firm using the exit year EBITDA and multiplying it by the industry’s average EV/EBITDA multiple. This will leave you with the terminal value of the firm, so you must discount it over the set period using the discount rate, in this case, WACC. Once you have the present terminal value, add the present value of the firm’s unlevered free cash flow to find the implied enterprise value. From there, your discounted cash flow (DCF) analysis is almost complete. All you have to do now is subtract net debt from the enterprise value to calculate the firm’s implied equity value. Divide that by the shares outstanding and that is your implied shared price using the discounted cash flow (DCF) Terminal EBITDA method.
Zoom Case Study
To illustrate, let’s take a closer look into the video communications industry and where Zoom Video Communications (NASDAQ: ZM) is trading relative to its peers.
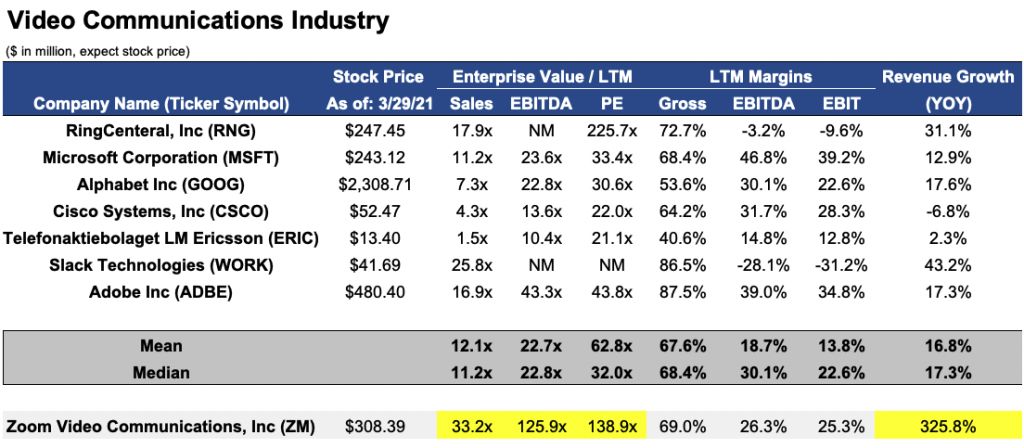
Looking at this table, Zoom is trading well above the industry average for its EV/Sales, EV/EBITDA, and PE ratios. The reason for this is largely due to the company’s revenue growing 325.8% year-over-year, whereas the average mean revenue growth for its competitors is only 16.8%. Because Zoom is growing at a much higher rate than its peers, investors are willing to pay a higher premium for the stock than competitors, therefore resulting in Zoom trading at much higher multiples than the industry average.
Conclusion
To sum it all up, there are many ways to value a stock including, but not limited to the methods discussed above. Each valuation method looks at different aspects of a company’s financials, so it’s important to deploy a variety of methods in order to take into consideration multiple aspects of the business. The market is not always a perfect reflection of the company’s value, and there are often varying opinions from investors and financial institutions regarding whether the stock is overvalued or undervalued. So when valuing a company, it is important to perform the necessary due diligence on the company and ensure that you thoroughly understand the business before formulating your investment thesis.
Romero Mentoring’s Analyst Prep Program

The Analyst Prep Program teaches the technical and practical skills that investment banks, hedge funds, and private equity & consulting firms look for in a candidate. Students begin with little to no technical skills and develop into fully prepared professionals who can perform as first-year analysts from day one through the program’s training and internship.
Our Story
Luis Romero, founder of Romero Mentoring, spent five years developing an analyst training program that he wishes he had when he was in college – especially one that gave him access to a complete training and finance internship experience that could advance his career. Since no opportunity like this existed to him at the time, Luis went through a stressful recruiting process like so many others have. He successfully landed a full-time job offer upon graduation and worked as an M&A analyst at Credit Suisse in NYC for two years. He then moved to the buy-side as a junior trader and analyst. After gaining experience there, he created his own fund, Romero Capital, and later become an instructor in financial modeling and valuation. After working with hundreds of professionals and analysts, Luis became committed to creating his own mentoring program because he understood the crucial need for a hands-on, personal experience in the competitive world of finance.